
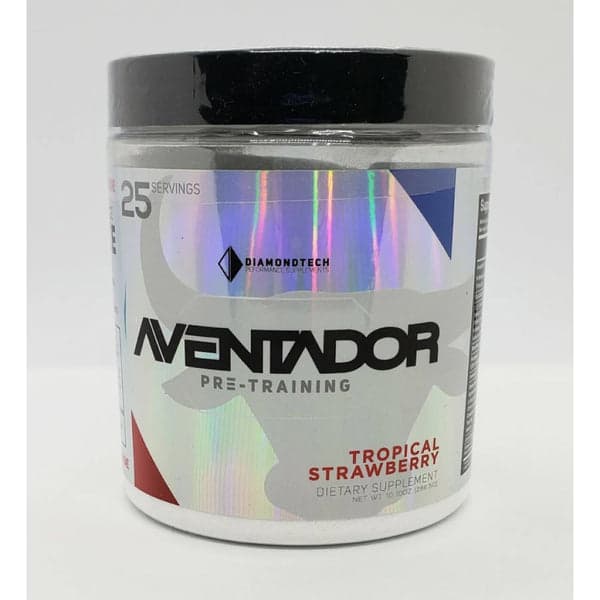
Aventador Pre Workout
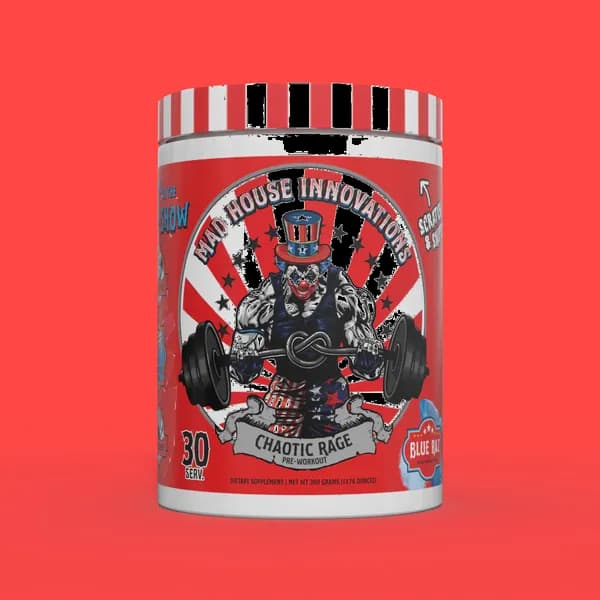
vs Chaotic Rage
Ingredient & Score Comparison
Last updated: Feb 2026
PwrRanks Verdict
Score Comparison
Objective scores based on ingredient dosing — 0 to 1 scale
Aventador Pre Workout delivers more performance per dollar than Chaotic Rage — based on how both products compare to the broader pre-workout market.
Ingredient Comparison
Aventador vs Chaotic Rage — dosing per serving
| Ingredient | Objective | Aventador | Chaotic Rage |
|---|---|---|---|
| Caffeine Yield | Energy | 400mg | 325mg |
| DMHA (Plant-Claimed) | Energy | — | 250mg |
| Eria Jarensis | Energy | — | 125mg |
| DMAA | Energy | 100mg | — |
| Theobromine | Energy | — | 100mg |
| DMHA | Energy | 50mg | — |
| Yohimbine HCl | Energy | — | 2mg |
| L-Citrulline Malate | Pump | 1g | 5g |
| Taurine | Pump | 2g | — |
| Agmatine | Pump | 1g | — |
| L-Tyrosine | Focus | — | 1g |
| Noopept | Focus | 10mg | — |
| Huperzine | Focus | — | 3mg |
| Beta-Alanine | - | 3g | 3.5g |
| L-Arginine | - | 1.5g | — |
| Creatine HCl | - | 1g | — |
| Beta PEA | - | — | 500mg |
| D-Aspartic Acid | - | 380mg | — |
| CDP-Choline | - | 300mg | — |
| Choline Bitartrate | - | — | 200mg |
| Tribulus | - | 150mg | — |
| Synephrine HCl | - | 60mg | 100mg |
| N-Methyl Tyramine HCl | - | 75mg | — |
| Niacin | - | 60mg | — |
Who Should Buy Each
Matching products to training goals and stim tolerance
Choose Aventador If…
- ✓You want nootropic-grade cognitive enhancement alongside your training
Choose Chaotic Rage If…
- ✓You want euphoric, mood-elevating formula
- ✓You want sharp mental focus that lasts through the full session
- ✓You want some pump support without it dominating the formula
Frequently Asked Questions
Common questions about these two pre-workouts
Aventador Pre Workout has 400mg total caffeine per serving compared to 325mg in Chaotic Rage.
More Comparisons
How PwrRanks Scores Pre-Workouts
Our methodology
PwrRanks scores every pre-workout by analyzing its ingredient label algorithmically. We generate four objective scores — Energy, Pump, Focus, and Value — that reflect what's in the tub, not how the product is marketed. Value scores are calculated using live pricing data to reflect real cost-per-serving at time of comparison.